
Best Practices to Handle Multiple Fact Tables in Power BI
Scenario 1: Multiple fact tables thar are not related to each other
Solution: Relate every dimension with their respective fact tables.
- Identify the shared dimensions.
- Relate them with every fact.

Sometimes this model is called constellation schema, where each fact table individually is a perfect star schema design because each one is related with a dimension.
Advantages
- Star schemas are easy to read, understand and use.
- Best performance.
- You can filter both fact tables using the shared dimensions.
Disadvantages:
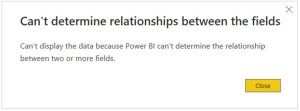
- As the fact tables are not related to each other if you try to add columns from both tables in the same visual that do not have a shared dimension you will get the following error:
Bad Practices:
- Duplicate dimensions in the model:
- You will increase the size of your model which could impact the refresh time.
- You can’t use the same dimension to filter the data of both tables.
- Consolidate the fact tables: Join fact tables through a union (append in Power Query) will create a huge table that can take a long time to refresh, in addition to a lot of blank values in the unmatched columns.
Scenario 2: Multiple fact tables related to each other with different granularities
Remember that the granularity represents the level of detail in each row of your fact table. In the header/detail models you must be careful to use the correct granularity in your calculations and try to maintain a good performance considering that they are not a perfect star schema.
An example of header/detail models is when you have an order (header) and order details. The order table has an order number, date, a customer, and much more useful information at the order level. The detail table contains the product, the price, the quantity, and detailed information related to the individual order line.
Solution 1: Flatten the header table into the detail table: With this solution you will get a denormalized model, where you locate the data from the header table to the detail table increasing the granularity.
Advantages:
- You will get a perfect star schema that offers all its advantages.
- The values will get the correct granularity.
- The model will be easier to use because it can be summed and sliced by any dimension.
Disadvantages:
- Increase the data model size.
- Categorical values repeated in the denormalized model.
Solution 2: Relate the header and detail table
Be careful with this solution because you could get incorrect results due to the granularity differences between both tables. You can use it in the following scenario:
- You need to use columns from the different fact tables in a same visual table.
- The header detail table had a big number of column and flattening it into the detail table would create a huge table.
- You need to make few calculations over the header.
- The reports just needed to be sliced using common dimensions.
Considering these points, apply the following solution:
- Identify the shared dimensions.
- Relate them with every fact to get a star schema model for every fact.
- Relate the header and detail table through an inactive relationship:

- Use a Many to one Cardinality and a “Both” cross filter direction:

- Finally, to summarize or bring the columns from the header table, use the USERELATIONSHIP DAX formula:
Contract Amount =
CALCULATE (
SUM ( ‘Fact Header'[Contract Amount] ),
USERELATIONSHIP ( ‘Fact Detail'[WIP PK], ‘Fact Header'[PK] )
)
In this solution, linking the header and the detail table breaks the rules of the star schema because both tables act as a dimension and a fact table at the same time.
It’s a dimension when you need to slice the detail and it’s a fact table when you summarize values at the header granularity.
So, you will get a snowflake when the header table acts as dimension, although you should avoid it, sometimes as in this specific scenario could be a good solution to representing the data.
Advantages:
- Avoid increase the size the data model having fact tables separated.
- You can use the star schemas to create reports that don’t need to include in a same visual, columns from different fact tables
Disadvantages:
- This solution only works if you slice the data using the common dimensions, because otherwise you will get incorrect results due to the granularity differences between both tables.
- Possible performance degradation.

