Walk into almost any bank, credit union, or insurer and you will find the same situation. The operational systems work fine. Core banking runs, policy administration runs, claims and billing run. The problem is that each one reports its own totals, and reconciling them burns days.
Critical numbers live in Excel files passed by email, each one a little different from the last. Every question becomes a ticket in the IT queue, and analysts wait behind IT while decisions wait behind analysts. The data works hard. It just works apart.
Microsoft Fabric changes the economics of fixing this, and the architecture that fixes it is remarkably consistent across financial verticals. Here is the pattern.
The architecture, left to right
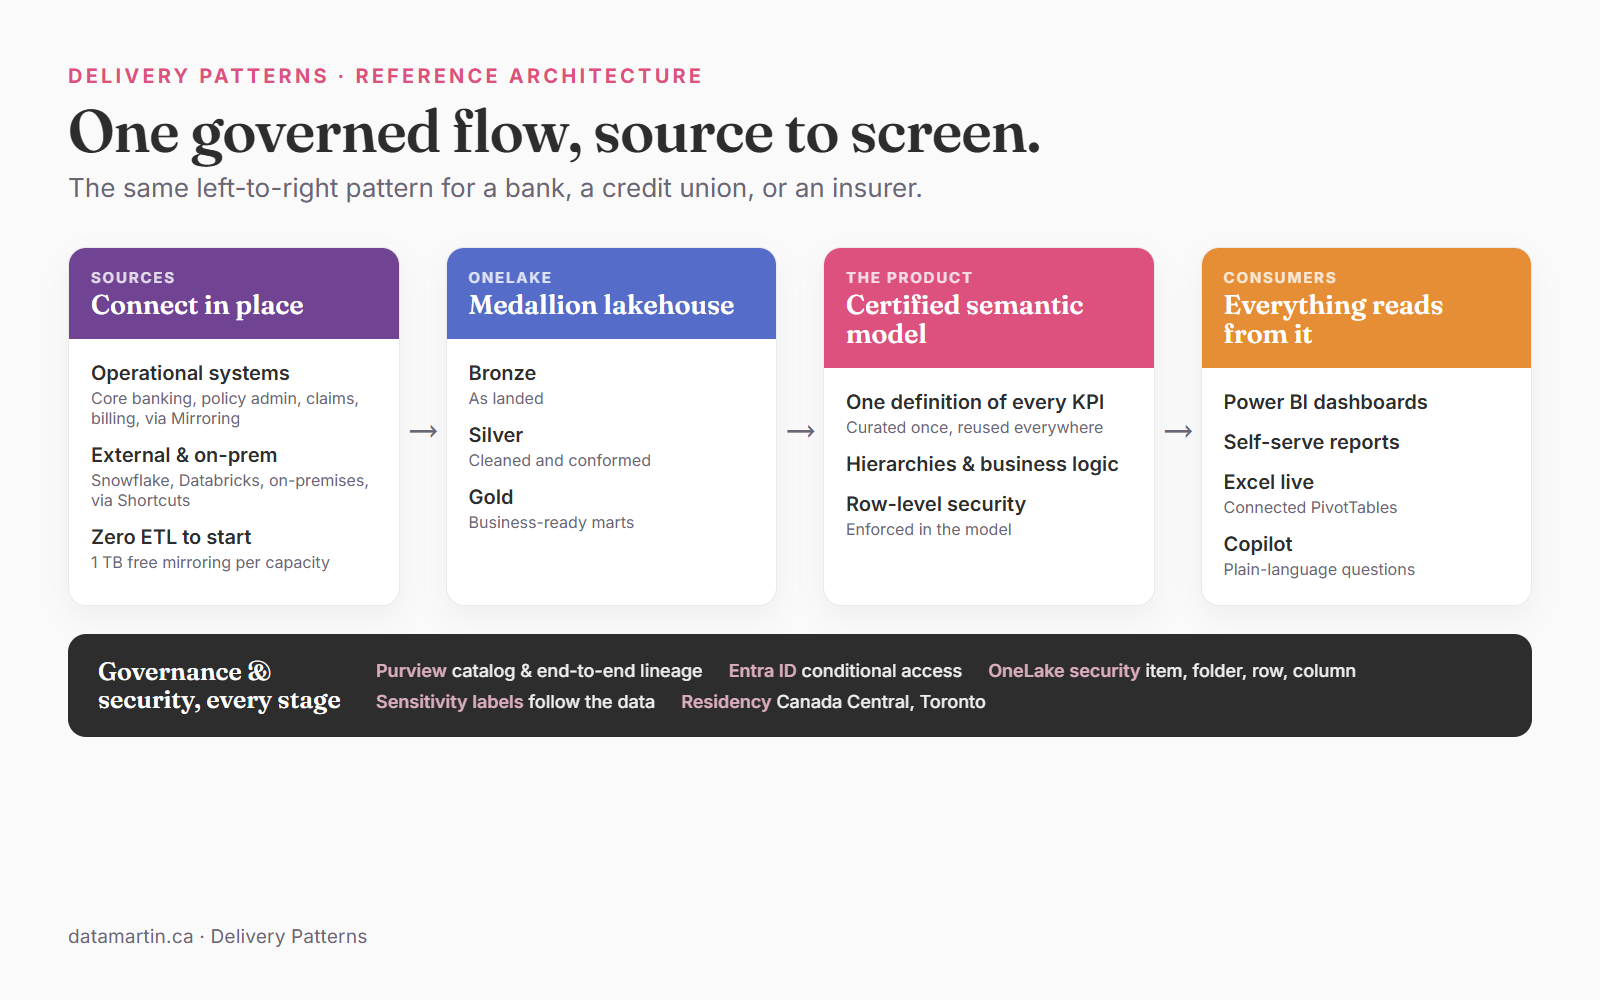
Sources connect in place. Mirroring replicates operational databases into OneLake in near real time, with no pipelines to build first. Shortcuts connect data where it already lives, including Snowflake, Databricks, and on premises systems, with no duplication. This is the part that surprises teams who lived through previous platform migrations: the starting cost is weeks of configuration, not a multi quarter ETL program. Every capacity unit also includes one terabyte of free mirroring storage, so the landing zone is effectively free at typical sizes.
A medallion lakehouse refines the data in governed steps. Bronze holds data as landed. Silver is cleaned and conformed. Gold is business ready, shaped into the marts that feed reporting. The layers matter in a regulated shop because each step is documented, repeatable, and traceable, which is exactly what an auditor wants to see.
One certified semantic model sits on top. KPIs, hierarchies, and business definitions are curated once, then reused by every report, every Excel workbook, and every AI agent. Row level security is enforced in the model, so a branch manager and a claims adjuster each see only their slice of the same certified numbers.
Everything reads from that model. Power BI dashboards, self serve ad hoc reports, Excel connected live through PivotTables, and Copilot answering questions in plain language. No exports, no stale copies. Excel stops being another copy of the truth and becomes a live window into it.
The whole point of the design is the last column. When the CFO, the risk team, and the branch or claims network all read from the same governed model, the argument about whose number is right simply ends.
The semantic model is the product
Most platform conversations get this backwards. Teams spend months debating lakehouse versus warehouse, which is a plumbing decision, and then treat the semantic layer as a reporting detail.
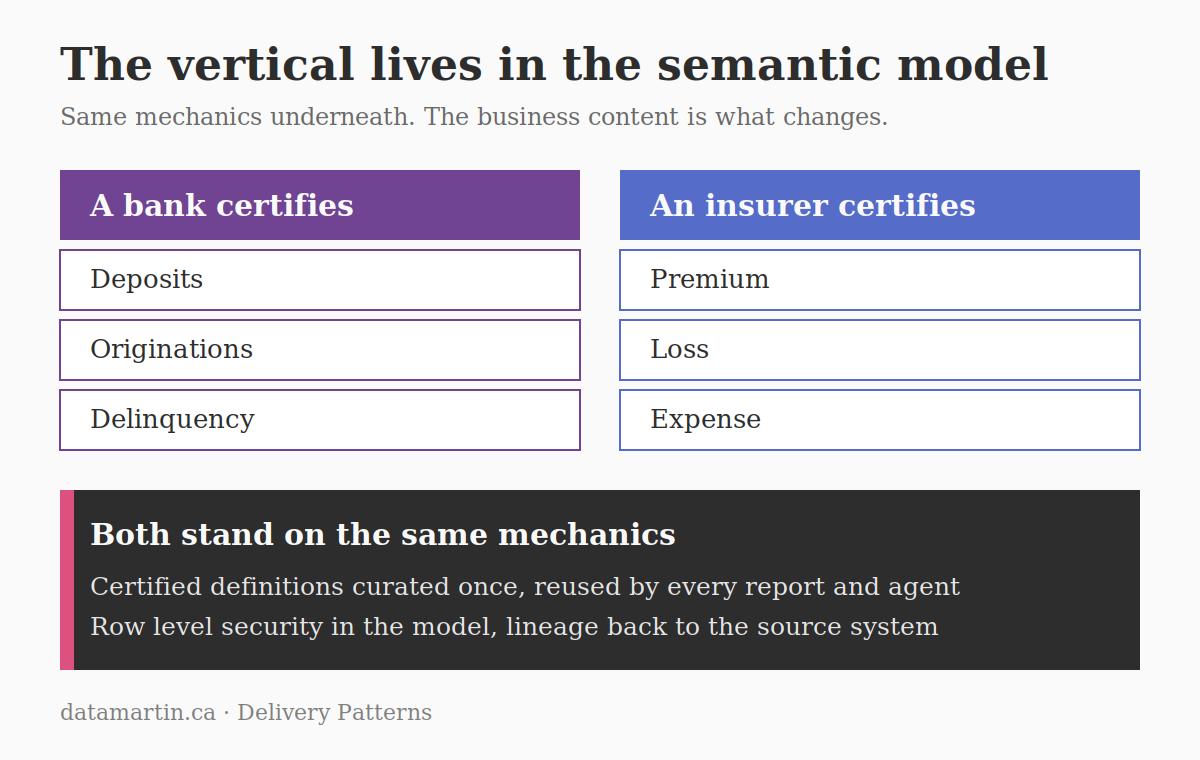
In a financial institution the semantic model is where the business actually lives. One definition of deposits, originations, and delinquency for a bank. One definition of premium, loss, and expense for an insurer. Same mechanics, different content. It is the layer the CFO touches, the layer the regulator asks about, and the layer where your institution’s knowledge accumulates.
The plumbing underneath is a solved pattern. The semantic model is where the real work, and the real value, sits.
The three questions every regulated institution asks
Before anyone in a financial institution cares about features, three gate questions have to be answered. Fabric has a credible answer to each one out of the box, which is a large part of why the platform conversation in financial services has gotten shorter.
Where does the data live? For Canadian institutions, capacity and OneLake storage deploy to Canada Central in Toronto, with Canada East available for disaster recovery. Data never leaves the country. Residency is not an appendix slide. If the answer is wrong, nothing else matters, so answer it on the architecture diagram itself.
Can we trace any number to its source? End to end lineage, from the dashboard back through every transformation to the operational system it came from. The Microsoft Purview catalog, data dictionary, and lineage graph answer this without a separate documentation project. Regulators ask for it. Auditors ask for it. So does anyone who has ever been challenged on a board number.
Who saw what? Entra ID conditional access checks user, device, and risk before data is touched. OneLake security applies at item, folder, row, and column level, enforced identically across every engine. Sensitivity labels follow the data even on export, and full audit logs support investigations. In a bank or an insurer, PII handling is the condition of doing the project at all.
The economics that survive the CFO conversation
Feature tours do not move a leadership audience. Two numbers do.
First, the zero ETL start. Mirroring and shortcuts mean the first governed reports arrive in weeks, not quarters, and the extract jungle starts retiring immediately. Time to first value is the number that kills most platform proposals, and this one is short.
Second, the licensing math. At F64 capacity and above, report viewers need no individual license. Only report builders need Power BI Pro. For an institution with thousands of staff and a few hundred builders, the comparison against per user licensing across the whole organization is not close. And the Capacity Metrics App shows exactly what consumes capacity, so you size on data rather than guesswork and pay for your average load, not your peaks.
Phase it, and let each phase stand alone
The delivery pattern is three phases, and the institution can take them whole or a la carte.
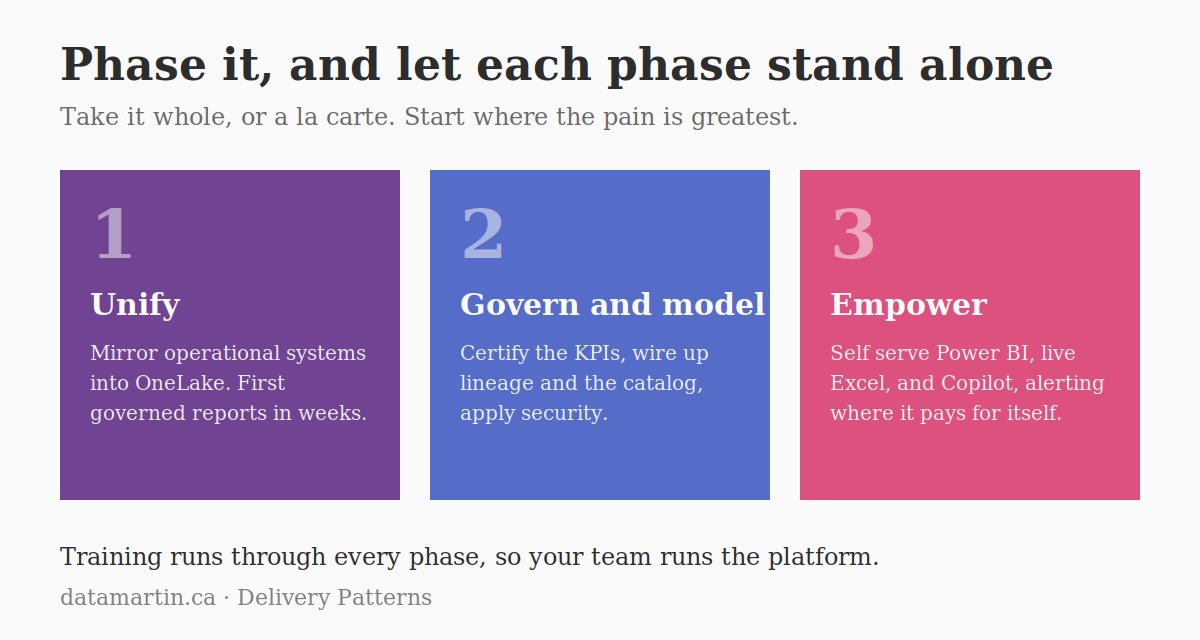
Unify. Mirror the operational systems into OneLake and retire the extract jungle. First governed reports in weeks.
Govern and model. Build the warehouse and the certified semantic model, certify the KPIs, wire up lineage and the catalog, apply row level security and sensitivity labels.
Empower. Roll out self serve Power BI, live Excel, and Copilot across the organization, with real time alerting for fraud, liquidity, or operational monitoring only where it pays for itself.
Each phase delivers standalone value, so you start where the pain is greatest rather than committing to a monolith. Training runs through every phase, because the goal is a platform your own team runs, not a permanent dependency on a partner.
What I tell clients
The platform risk conversation in financial services is largely settled. Regulated institutions are running Fabric in production today, in some cases alongside Snowflake and Databricks with no duplicated data. The open questions that remain are yours, not the platform’s: which sources come first, which KPIs get certified, and who owns the definitions.
Those are the right questions to be stuck on. They are business questions, and the semantic model forces you to answer them. That is a feature.
Building a Fabric platform in a regulated industry? Book a discovery call.