Delivery Patterns, by DataMartIn
Out of the box, Microsoft Fabric pipelines fail in ways that are easy to miss. A pipeline shows green because the run completed, but the notebook inside it silently swallowed an exception. A Dataflow Gen2 refresh “succeeded” while processing zero rows, because the source returned an empty file. A Lakehouse load looks fine until you notice the row count is exactly the same as yesterday and the day before that.
The Fabric portal will not tell you any of this. It tells you the run finished. That is a different question from whether the data is correct.
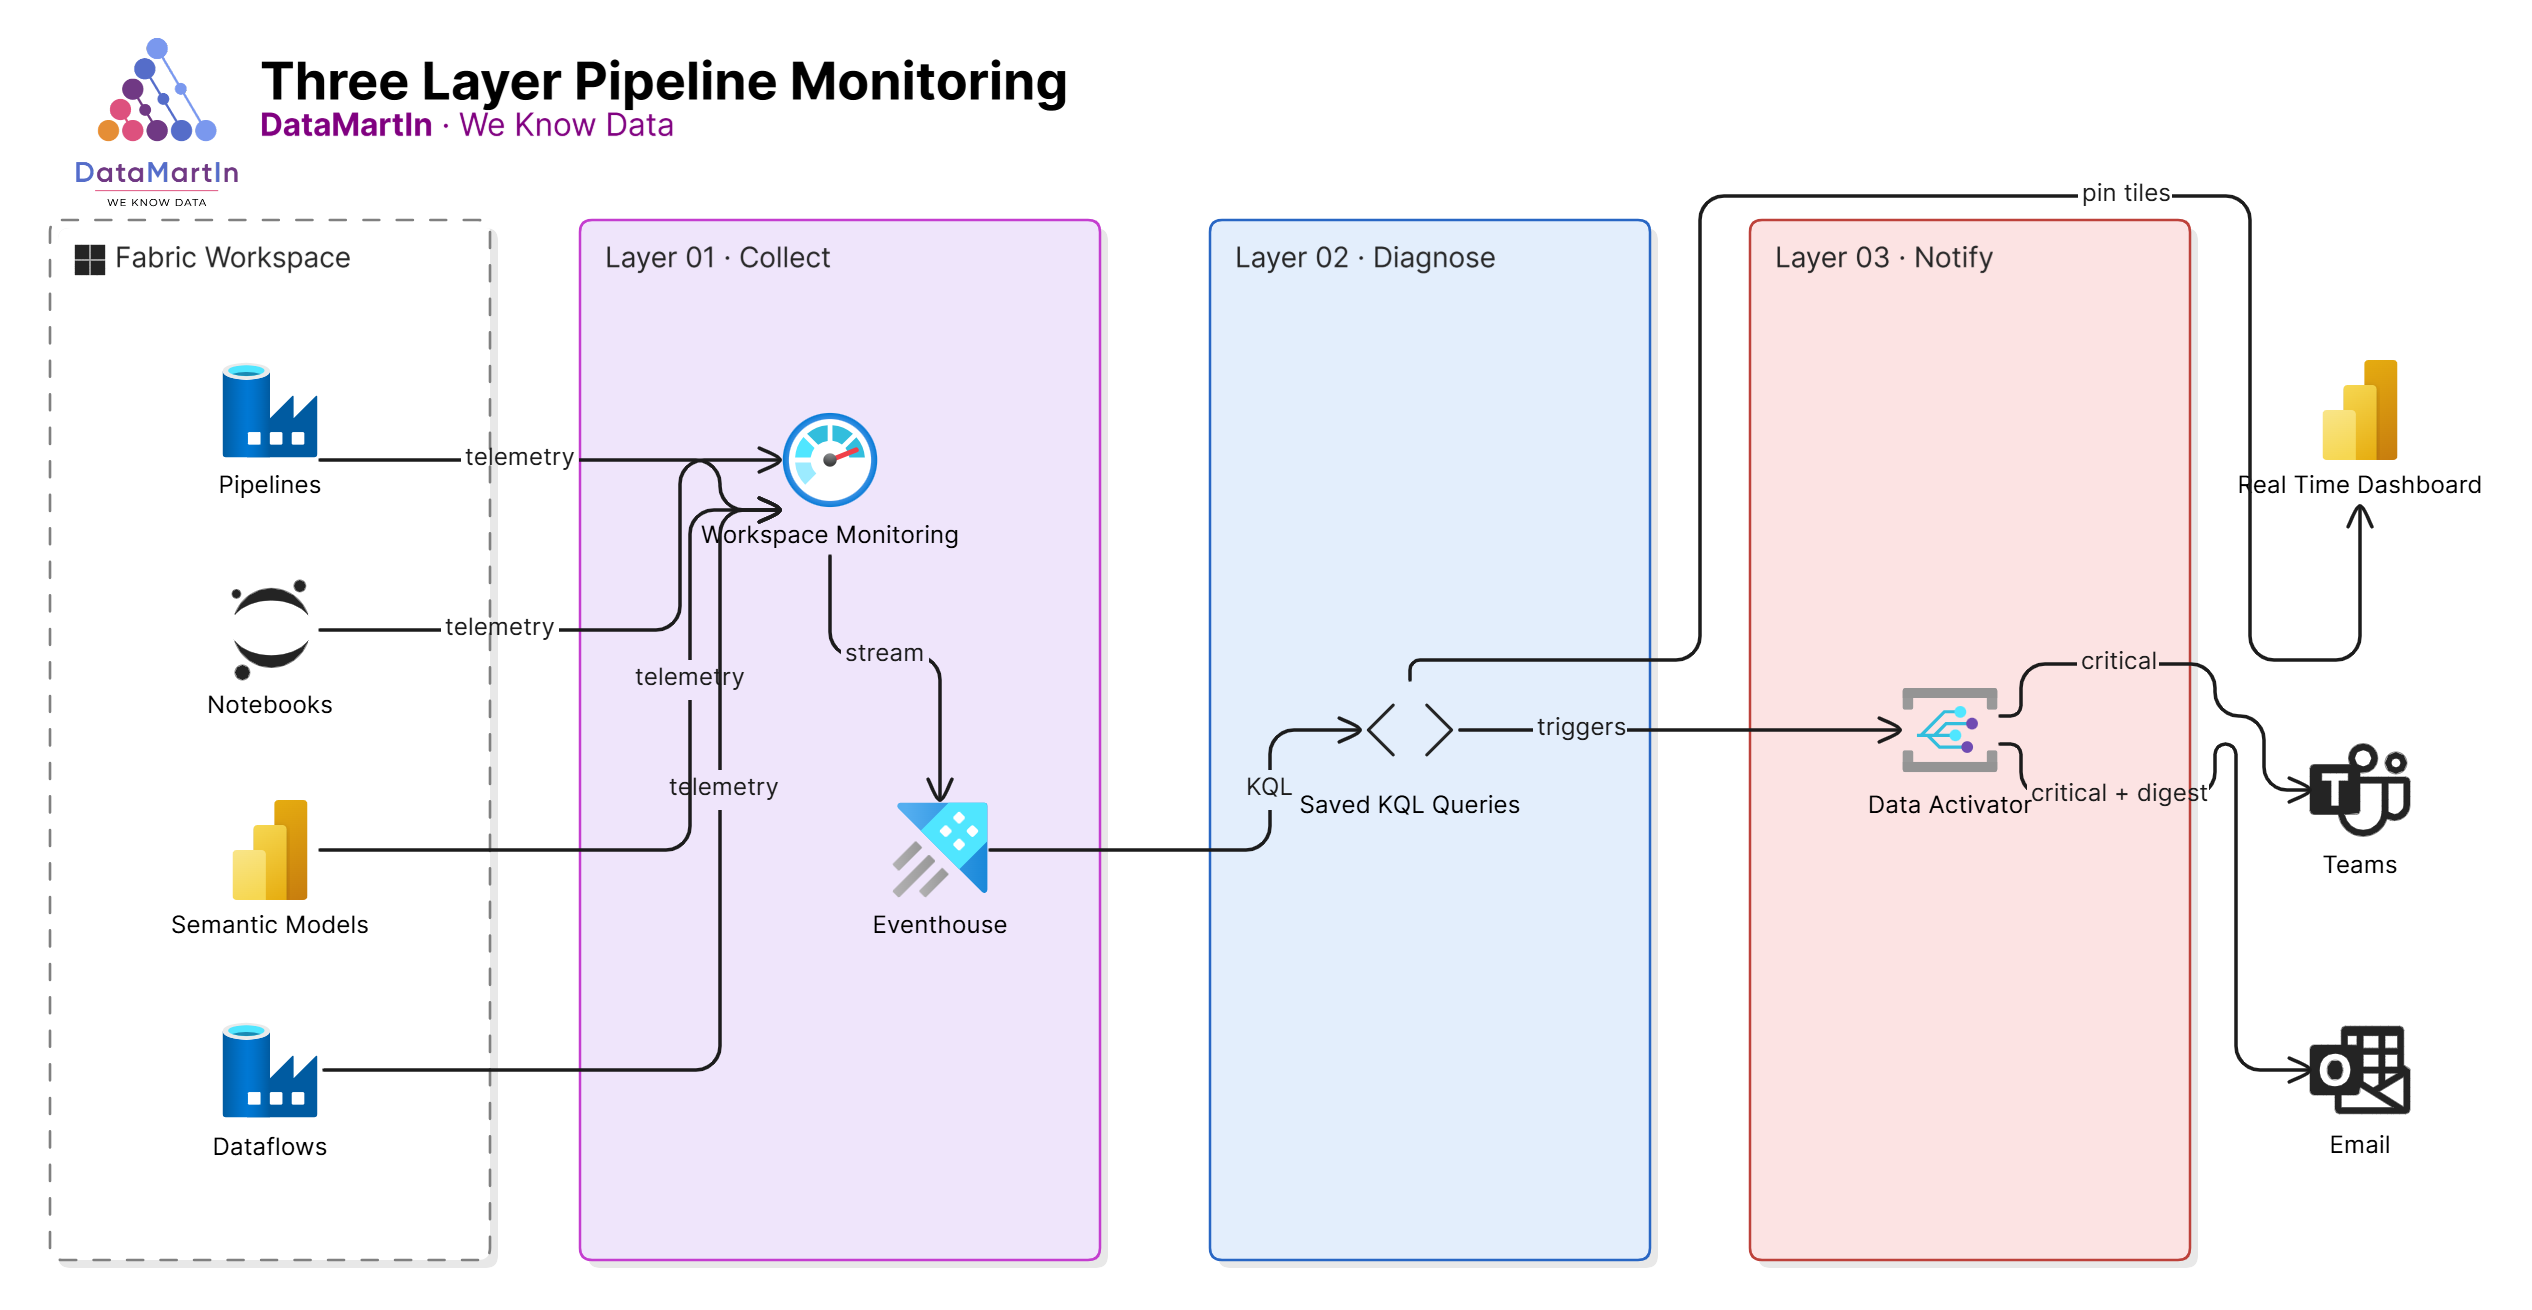
After a couple of years shipping Fabric platforms into production, we now deploy the same three-layer monitoring pattern on every engagement. Each layer answers a different question. Together, they catch the silent failures before the business does.

Layer 1: Workspace Monitoring (the always-on baseline)
Workspace Monitoring is the Fabric feature that streams operational telemetry from every artifact in a workspace into a dedicated Eventhouse. Pipeline runs, semantic model refreshes, notebook executions, capacity events. All of it lands in KQL tables, queryable in real time.
This is the foundation. We turn it on for every workspace in scope on day one of an engagement. There is no real reason not to. The cost is minimal, retention is configurable, and it gives you a single source of truth for what actually happened in the workspace.
If you skip this step, every other monitoring layer becomes a workaround. Build the foundation first.
Layer 2: KQL queries on the monitoring Eventhouse (the diagnostic layer)
Workspace Monitoring gives you the data. It does not give you the questions.
These are the questions we ask on every project, written as saved KQL queries against the monitoring Eventhouse:
- Which pipelines ran in the last 24 hours, and which had any non-success step?
- Which semantic model refreshes took more than two standard deviations longer than their 30-day average?
- Which notebooks completed but logged a Python warning or error to stdout?
- Which Lakehouse tables had no row delta in the last expected refresh window?
- Which capacity hit a throttling event, and what artifact triggered it?
Each gets a saved KQL query in the workspace, with a sensible time window and a clear name. We pin the most important ones to a Real-Time Dashboard, so the delivery team has a single page to glance at every morning.
The point is not to write clever queries. The point is to write the boring queries that catch the boring failures, because those are the ones that actually happen.
Layer 3: Data Activator (the human notification layer)
The first two layers tell you what happened if you go looking. Data Activator goes looking for you and tells someone when it finds something.
We build Activator triggers on top of the KQL queries from Layer 2. The pattern is consistent:
- The trigger condition matches the failure question (pipeline failed, refresh slow, row delta zero).
- The notification routes to a Teams channel for the delivery team and an email for the client owner.
- The message includes the artifact name, the workspace, the timestamp, and a deep link back into Fabric.
The deep link is the part most teams miss. An alert that says “Pipeline X failed” is half a notification. An alert that drops you into the failed run with one click is the difference between a 30-second triage and a 30-minute one.
We also tier the triggers. Critical (a data product is broken) goes to Teams and email immediately. Warning (something looks off but is not broken yet) goes to a daily digest. Informational (a refresh ran longer than usual but still inside SLA) stays on the dashboard. Without tiering, every alert is treated like the first one. And the first one is the one that gets ignored.
The pattern in summary
- Layer 1 collects everything.
- Layer 2 asks the right questions of it.
- Layer 3 surfaces the answers to the right people, in the right channel, at the right urgency.
Each layer is cheap on its own. Together they replace the “the report is wrong, why didn’t anyone tell me” conversation that every analytics team has had at least once.
Why we make this standard
A Fabric platform that ships without observability is a Fabric platform that fails without anyone knowing. We have seen too many engagements where the build was beautiful and the operations were blind. The cost of bolting monitoring on after go-live is always higher than the cost of building it in.
If you are scoping a Fabric engagement, this should be a line item, not a stretch goal.
Need a Fabric platform that tells you when something is wrong before your business users do? Book a discovery call.