Is your data model turning into an unfriendly monster full of unnecessary columns and measures with long refresh time?
Or after cleaning up your data model, do you find that connected reports break so you manually go through each one to find the cause?
In this post I will introduce you to the first version of a tool I created to help you in the process of clean your data models, which can become a nightmare if you don’t have an effective and fast way to do it.
Challenge
When developers remove unnecessary objects from large data models, connected reports break a and the validation process is manual, tedious and time-consuming.
Solution:
When I tried to clean my data models I couldn’t find any tool with all the functionalities I needed, so decided to create my own using Power BI, which allows:
– Obtain all the dependencies of the data model in an efficient and automated way.
– Identify the list of objects (measures, columns, calculated columns, tables) in use and those that are not, in the reports connected to the Power BI or SSAS Data model.
I hope it can help you in the process of keeping your data models optimized 😊.
How It Works
This tool contains two parts:
1. Get the dependencies between all objects in the data model: This tool identifies how all the objects in your data model are connected to each other. For example, if you want to remove a measure, you will be able to detect the impact on your reports.
To get the dependencies I used Dynamic Management Views (DMV) which are queries that return information about model objects, server operations and server status. If you want to know more that DMVs, check our article What are Dynamic Management Views (DMVs) and what are they for?.
The main DMV that I used is the DISCOVER_CALC_DEPENDENCY, which Returns information about the calculation dependency for an object that is specified in a Tabular database or in a DAX query that is executed against a Tabular database.
2. Identify the objects used in the data model: For that I used the tool “Report Analyzer” explained in detail in this article: Report Analyzer
Finally, I related the information provided for the DMVs and I merged it with the information generated for the Report Analyzer in a Power BI report.
How to Use the Tool
You can use this tool in any Power BI data model with the following simple steps:
1. Get the connection details of a Power BI Dataset
Local Power BI Dataset:
Open a Power BI Dataset that you want to document. Open DAX Studio and choose the “PBI / SSDT Model” data source option, then click on Connect:

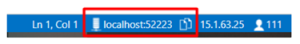
In the lower right-hand corner of the screen is the name of the server, and the port number you have connected to. In this case it is localhost:52223
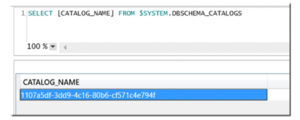
Run the following DMV query in a DAX query window. This will give you the GUID, the name of the only database in the Power BI data model:
SELECT [CATALOG_NAME] FROM $SYSTEM.DBSCHEMA_CATALOGS
Power BI Premium
– Server: Go to “Workspace settings” and copy the Workspace Connection.
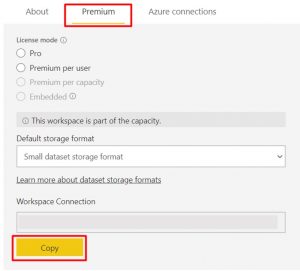
– Database: Is the dataset name.
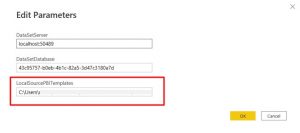
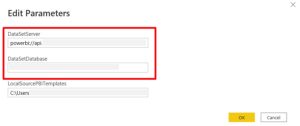
2. Update the Dataset parameters in the Data model cleaner tool:
3. Get all the objects used in the Power BI reports connected to the data model:
– Save all the PBI report files connected to the golden dataset in a folder.
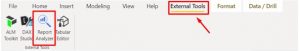
– Open External tool: Report Analyzer:
– Click on “Select folder”:
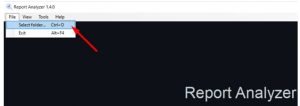
– Select the respective folder, and select “Export Report Metadata”:

– You will see the following message:
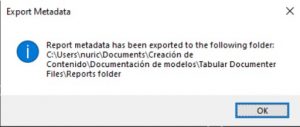
The files in .txt format will be saved in the same folder where the reports are.
4. Update the “LocalSoucePBITemplates” parameter in Power BI:
Type the location of the folder with the .txt files generated by the Report Analyzer:
Information provided by the Data Model Cleaner tool
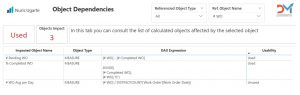
– Object dependencies: On this tab you can consult the list of calculated objects affected by the selected object:
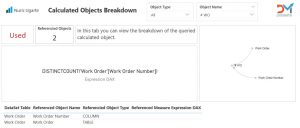
– Calculated Objects Breakdown: This tab shows the breakdown of the queried calculated object.
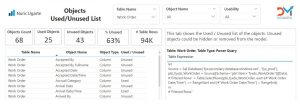
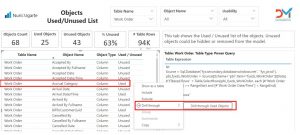
– Objects Used / Unused List: On this tab you can easily consult the Used / Unused list of the objects that will help you make decisions about hiding or removing them from the model.
If you consult by table additionally you will see the “M” or DAX expression of the table.
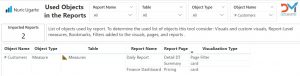
To determine the used list of objects this tool consider:
- Visuals and custom visuals
- Report-Level measures
- Filters added to the visuals, pages, and reports
- Bookmarks
You can also drill through on any object used and consult the reports, pages and in which of the visualizations this object is being used:
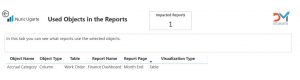
– Used Objects in the Reports: List of objects used by report.