
Delivery Patterns, by DataMartIn
A reader asked the right question after our last post on three-layer pipeline monitoring: “This sounds great, but what does it cost in CUs?”
The honest answer is that Microsoft has not published authoritative figures for Workspace Monitoring’s capacity consumption, and the Capacity Metrics App will tell you what your Eventhouse cost yesterday but will not separate “monitoring overhead” from “everything else my Eventhouse is doing.” The only way to get a real number for a specific environment is to instrument it and measure.
This post does two things. It walks through the rough cost ranges we have observed across several engagements, and it gives you a query you can paste into your own monitoring Eventhouse to measure your actual overhead in your own capacity.

The short answer first
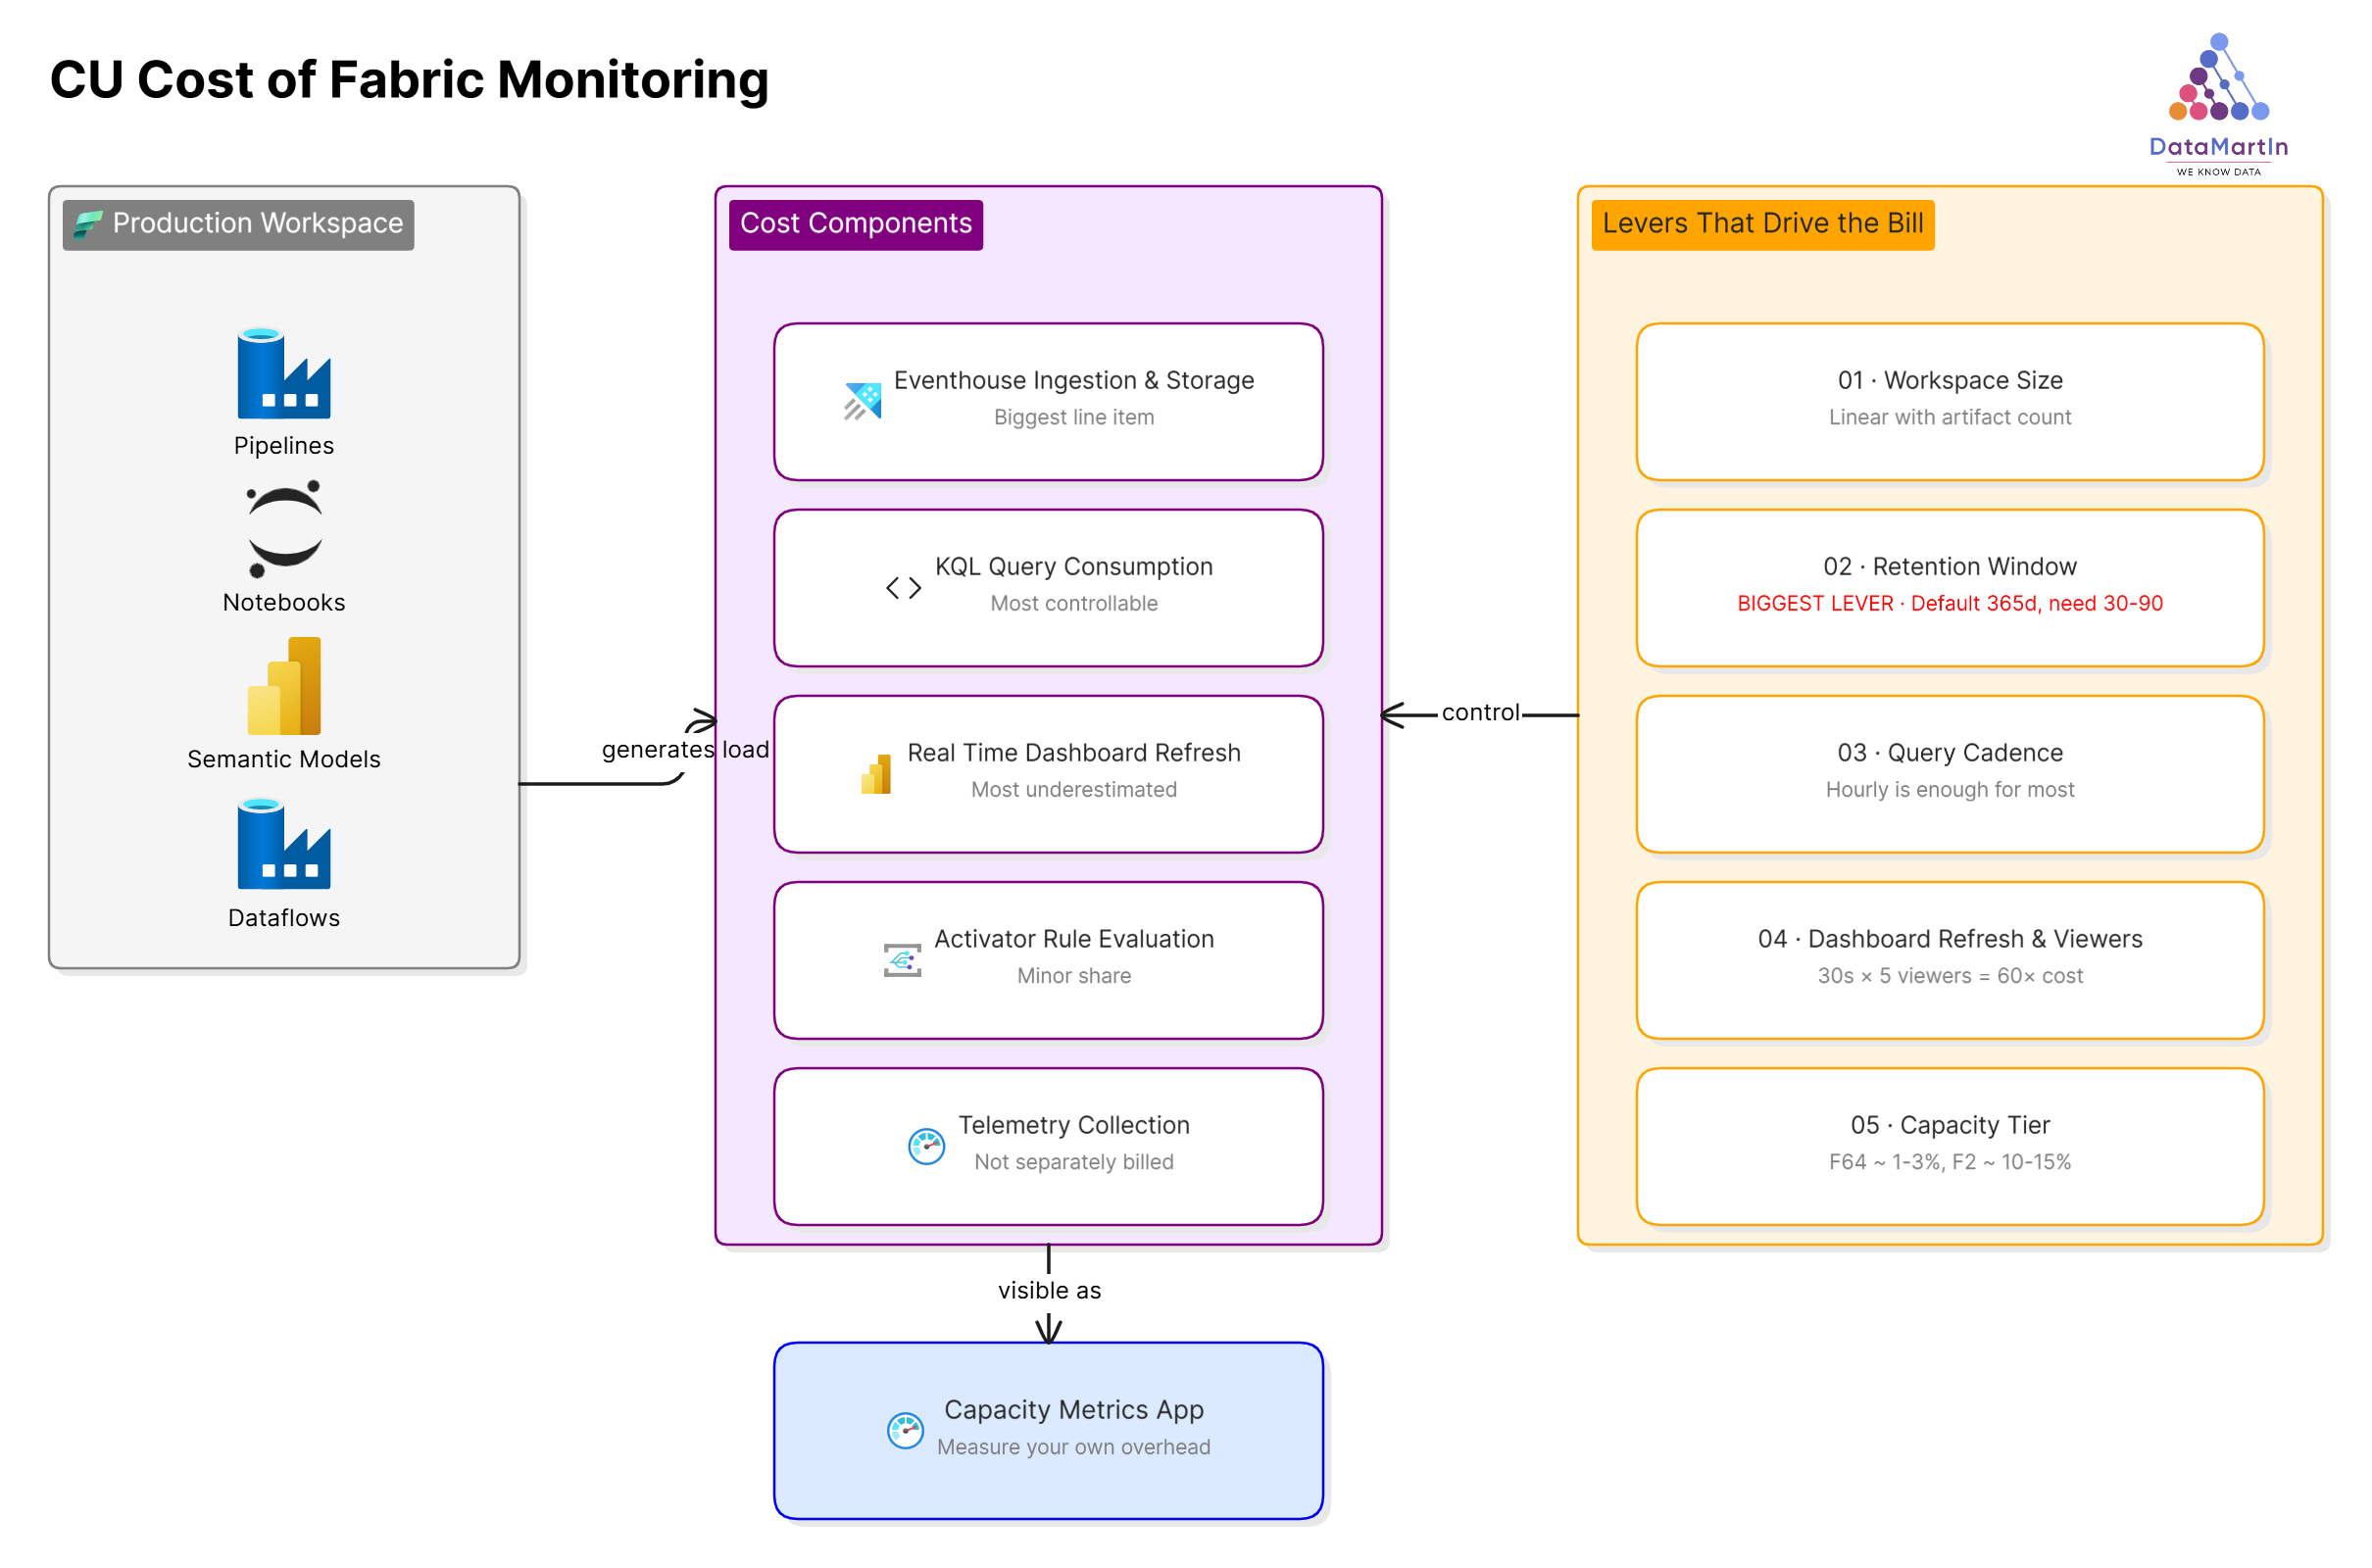
For most workspaces in the small-to-medium range, a few dozen artifacts running on normal cadences, with monitoring deployed as described in the previous post, the full stack of Workspace Monitoring, Eventhouse, saved KQL queries, Real-Time Dashboard, and Data Activator typically consumes somewhere between one and three percent of an F64’s daily CU budget.
On smaller fractional capacities like F2 through F8, the percentage looks higher even though the absolute cost is similar, because the Eventhouse baseline is fixed and your total budget is smaller. On larger capacities like F128 and above, monitoring overhead drops below one percent and disappears into the noise.
These are rough working numbers, not Microsoft-published figures. Your environment will land somewhere in this range or outside it, depending on the five variables below.
Where the CUs actually go
Five components contribute to the bill, in roughly descending order of impact.
Eventhouse ingestion and storage. This is the biggest line item. The telemetry stream from every artifact in the workspace is continuously written to the monitoring Eventhouse. Storage is cheap, but the ingestion stream consumes CUs in proportion to the volume of activity in the workspace. A workspace with five active pipelines refreshing hourly produces less telemetry than one with fifty pipelines refreshing every fifteen minutes. The relationship is roughly linear with artifact count and inversely related to refresh interval.
KQL query consumption. Every saved query that runs against the Eventhouse consumes CUs proportional to the data scanned. A query against a seven-day window is cheaper than the same query against a ninety-day window. A query that runs once an hour is cheaper than the same query running every five minutes. This is the most controllable cost in the stack, which we will come back to.
Real-Time Dashboard auto-refresh. Every user with a Real-Time Dashboard open is running the underlying queries on the dashboard’s refresh interval. Five users with a thirty-second refresh on a busy dashboard generates more query load than the saved queries themselves. This is the cost most teams underestimate.
Data Activator rule evaluation. Activator rules consume CUs when they evaluate against incoming data. The per-evaluation cost is small, and even fifty active rules barely register on an F64. On a fractional capacity, this becomes more visible, but it is still a minor share of the total.
Workspace Monitoring telemetry collection. The collection itself is not separately billed. The cost surfaces as Eventhouse ingestion, which we already counted in the first bucket.
The five variables that actually drive the bill
How much you pay for monitoring is decided more by configuration than by anything inherent to the feature.
Workspace size and artifact count has a roughly linear effect on telemetry volume. There is no realistic way to reduce this short of removing artifacts. It is a fixed input to the cost model.
Retention window is the single biggest lever. The default retention on a monitoring Eventhouse is one year. For the use case described in the previous post, operational alerting and capacity health, you almost certainly do not need a year of telemetry. Thirty to ninety days is enough for the questions you are actually asking. Cutting retention from 365 days to 60 days dramatically reduces the data scanned by every long-window query and visibly drops the daily CU consumption.
Query cadence matters more than query complexity. We see teams set saved queries to run every five minutes “just in case,” when the underlying business question is comfortably answered hourly. Move every monitoring query to the slowest cadence that still meets the actual response time you need. For most pipeline failure detection, “within an hour” is fine.
Dashboard refresh interval and concurrent viewer count is the multiplicative cost most teams miss. A thirty-second auto-refresh with five viewers is sixty times the query load of a five-minute auto-refresh with one viewer. For a dashboard that exists to be glanced at once a morning, set the refresh to manual or to fifteen minutes, and stop paying for second-by-second updates nobody is watching.
Capacity tier is the denominator. The same monitoring stack on an F64 is one to three percent of capacity. On an F2, the same stack might be ten to fifteen percent. The absolute cost is similar, but the percentage of your budget changes everything about whether monitoring is “free overhead” or “a meaningful chunk of the bill.”
Measure your own overhead
Stop guessing. The Capacity Metrics App can tell you what your monitoring Eventhouse is consuming, broken down by operation. Here is the workflow we run on every engagement to actually quantify monitoring overhead in CUs.
Open the Microsoft Fabric Capacity Metrics app from your workspace and select the capacity that hosts the monitoring Eventhouse. Filter to the workspace where Workspace Monitoring is enabled. Look at the “Items by operation” page and find the rows attributed to your monitoring Eventhouse. The CU(s) and percentage of capacity columns are your answer.
To compare against total capacity consumption, look at the same time window in the multi-metric ribbon chart on the overview page. Divide the monitoring Eventhouse total by the capacity total. That is your real overhead percentage, measured rather than estimated.
Two pitfalls to be aware of. The first time you run this, run it across at least one full week to capture both the high-traffic weekday pattern and the low-traffic weekend pattern. A single Wednesday will overstate your typical cost. The second pitfall: if your monitoring Eventhouse is shared with other workloads, for example, you also write business telemetry into the same Eventhouse, the App will not separate “monitoring” from “everything else in the Eventhouse.” For a clean read, monitoring should live in its own dedicated Eventhouse.
If you want a query rather than the App, the same monitoring Eventhouse you set up in the previous post tracks its own usage. A KQL query against the operational telemetry table, filtered to artifacts in the monitoring workspace and aggregated by day, gives you a self-reported view of monitoring’s footprint. We have not standardized that query across engagements yet, but it is on the list.
A note on capacity isolation
One question worth flagging before the recommendations. Workspace Monitoring creates its Eventhouse inside the workspace it monitors, on that workspace’s capacity. You cannot currently redirect monitoring telemetry to a separate, smaller capacity dedicated to observability. Microsoft has signaled this on the roadmap, but as of now, monitoring is co-located with the workload it monitors.
Two facts soften this. Microsoft documents that Workspace Monitoring’s Eventstream ingestion and KQL queries against the monitoring Eventhouse continue to function even when the capacity is throttled. So even on a saturated capacity, the monitoring data keeps flowing. What is not insulated are the Power BI reports and Activator alerts built on top of the monitoring database. Those respect the capacity state and get throttled. So the half of monitoring you most need during an incident, the alerts, is the half that competes with production load.
If the multi-workspace-to-single-capacity feature ships, the architecture changes meaningfully. Worth keeping an eye on the Fabric release notes if this matters to you.
What we recommend after measuring
Once you have your own number, the response depends on where it lands.
If monitoring overhead is under one percent of capacity, do nothing. The cost is invisible and the value is real.
If overhead is between one and five percent, look at retention and dashboard refresh first. You can usually cut the cost in half without losing any operational value by dropping retention to sixty days and slowing dashboard refresh to fifteen minutes.
If overhead is above five percent, something is misconfigured. The most common culprits we see are a Real-Time Dashboard set to ten-second refresh that nobody is actively watching, a saved query running every minute against a ninety-day window when hourly would do, and retention left at the default 365 days when nobody ever queries data older than 30 days. Any one of these can double the bill on its own.
If overhead is above ten percent on an F64 or above, stop and audit before adding any more monitoring. The pattern as described in the previous post should not cost that much. Something specific to your environment is driving it, and continuing to add components on top of a misconfigured base only compounds the problem.
A separate consideration runs across all three tiers. As noted above, you cannot today move the monitoring Eventhouse to a separate capacity. So if production-impact-from-monitoring is your concern, the lever is to keep production workloads on a capacity sized comfortably for their normal load, with enough headroom that monitoring spikes do not push you into throttling.
What I tell clients
Monitoring is not free, and “negligible” is not the same as “free.” But on any capacity above F8, with sensible retention and cadence settings, the cost is genuinely small relative to the operational value.
The point of measuring is not to decide whether to monitor. Monitor anyway. The point is to know what you are paying so that when someone in finance or platform engineering asks the question, you have an answer with a number in it instead of a shrug. Few things hurt the credibility of a data platform faster than the team running it not knowing what it costs.
If you measure your own overhead and the number surprises you in either direction, send it. We are collecting real numbers from real environments to replace the rough ranges in this post with actual data, and the more capacity profiles we can compare across, the better the next version of this post will be.
Need help instrumenting your Fabric capacity for cost visibility? Book a discovery call.
-Martin Rojze