This second article is focused on best practices for designing your data model, optimizing CPU, RAM, and workspace capacity consumption by minimizing memory usage.
Benefits.
- Reduce space and processing time.
- Faster refresh times.
- Lower latency reports.
- Reduce the time development.
- More user-friendly data models because the user will not navigate through a bunch of useless objects that are not needed to build the reports.
– Choose the appropriate dataset mode for your solution: You can use Import, DirectQuery, and Composite model.
There are a variety of factors to consider when deciding which method to use, so I recommend that you review the advantages, disadvantages, and limitations of each in the Microsoft documentation so that you can select the correct one.
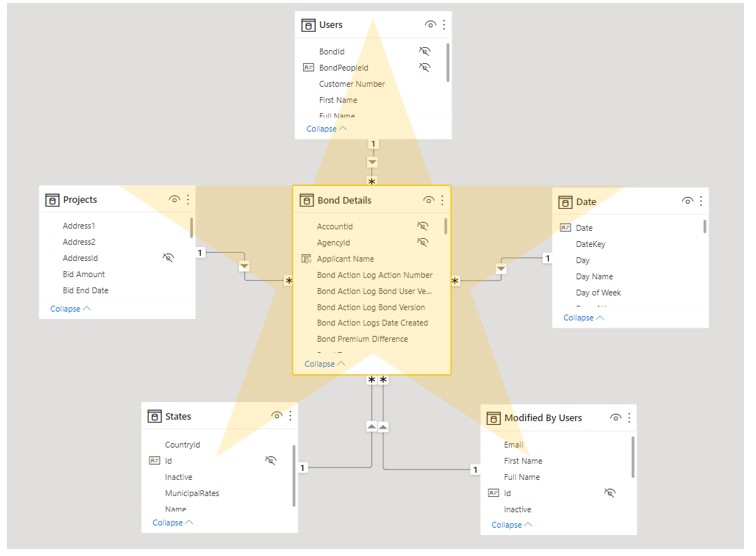
– Build your data model using a star schema architecture avoiding snowflake schema:
Benefits
- More user friendly.
- The DAX formulas are simpler.
- The time refreshes are faster.
- Reduces redundant data
Star schema are specialized data models used when designing data warehouses, the tables are classified as either dimension or fact. In this schema the fact sits in the middle and the dimensions are all around related directly to the fact which gives it the shape of a star.

– Only include the essential columns to create the reports: You do not want a report larger than necessary. However, removing the unnecessary columns could be too complicated when you have a lot of reports connected to the dataset because they can break.
I created a tool to help you to clean up your data models easily and quickly, you can download it for free, visit the link: Tabular model cleaner.

– Load in your data model the necessary tables: Probably you need to import a table in Power Query to make intermediate calculations but if you won’t use this table in your reports remember unchecking the “enable load” option in Power Query:

– Apply an Incremental Refresh policy to reduce the amount of data: Power BI desktop is limited for your computer resources, if you are working with very large models will be necessary configure the Incremental refresh.
Benefits
- Optimize your time development because you work over a smaller data model.
- Shorter data refresh time.
- Lower resource consumption in the Power BI Service.
Check our article: Configure an Incremental Refresh Policy in seven steps

– Group by and summarize combined with composite models: Depending on the level of granularity that you need to handle in your reports you can group your data by month, division, city for example.
In case you have to visualize a detail of the data, you can create a composite model and adding a drill through page that retrieves the detail data from a DirectQuery table.
For more detail check: Composite Models in Power BI Desktop
– Avoid many-to-many relationships: Most of the time, this can be avoided by creating a bridge table with unique values and one-to-many relationships from the bridge table to the fact tables, thus adopting star schema.

– Avoid both-directional relationships in your data model: You need to have a solid data modeling knowledge to measure the impact of this type of relationship in your data model, otherwise this could cause:
- Unexpected results
- Performance problems

Instead of creating a bi-directional relationship, try using a measure like the one below to get the value you need:

– Add a date table to your model and mark it as a date table.

– Disable auto date/time option: This avoids Power BI automatically create a lot of date dimension tables in the background.

– Disable the “Autodetect new relationships after data is loaded” option: Because you could mess up your data model if you do not have solid experience in data modeling.

– Remove columns with high cardinality: High cardinality columns can be particularly expensive. If possible:
- Remove columns such as GUID and timestamp from a SQL Server table from your model.
- Splitting Datetime columns in two columns, one for date and one for time.

– Select the correct data type: Don’t use decimal type if you only need the whole number or if your data granularity is at day level don’t use Date/Time data.
– Create measures instead of Calculated Columns: Using measures where applicable will help reduce data model size and increase the efficiency of the calculations.
– Create custom columns in Power query instead of DAX calculated columns: The custom columns created in Power Query achieve a better and more efficient compression.
– Use tools as DAX Studio and Bravo you to analyze where your model consumes the most memory: and choose which columns and tables you should remove to optimize it.

– Use the tool Tabular model cleaner to analyze the impact in your reports of make changes or removing objects from your data models.

Click here for part 3 of this series.